From your next trade, write one word next to the P&L about how you felt before entering (“rushed”, “bored”, “wanted to win it back”). After a week, count wins and losses by feeling. That alone starts to show which traps in the map below show up for you.
A map by situation
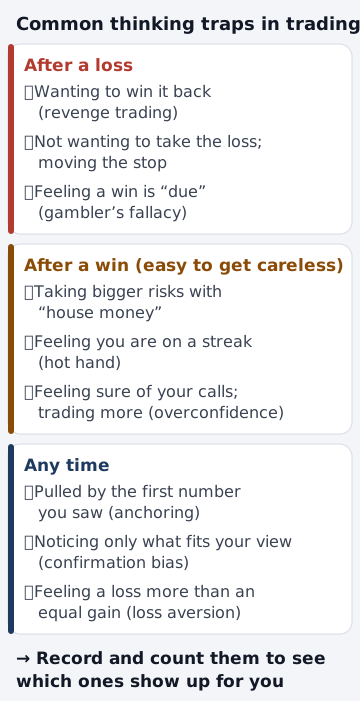
After a loss
In experiments, people who had just lost money were more likely to choose bets that offered a chance to break even.[2] A study of traders at the Chicago Board of Trade found that traders who lost money in the morning tended to take above-average risk in the afternoon.[3]
- Wanting to win it back: jumping straight back in with a bigger size after a loss. → How to stop revenge trading
- Not wanting to take the loss: moving your stop further away. → Why you move your stop loss, and what to check first
- Feeling a win is “due”: in roulette records from one US casino, after six or more of the same outcome in a row, 85% of bets were placed on the opposite outcome.[4] → The gambler’s fallacy in trading
How to spot it in your records: count the trades you entered soon after a loss (for example, within 30 minutes) and the size you used.
Losing streaks happen naturally over many trades, even when your win rate stays the same. → Losing streaks, seen through probability
After a win
A 1990 paper used the term “house money effect” for taking more risk after a prior gain.[2]
- Taking bigger risks with “house money”: raising your size after a big win. → The house money effect
- Feeling you are on a streak: three wins in a row, so today must be your day. → The hot hand
- Feeling sure of your calls, and trading more: a study of 66,465 US households at a brokerage found that the households that traded most tended to earn less after costs.[5] → Overconfidence and trading too much, How to notice overtrading
How to spot it in your records: count the days when your size or number of trades after a win was higher than usual.
Any time
- Being pulled by the first number you saw (anchoring): groups that saw 10 or 65 on a wheel of fortune gave median estimates of 25% and 45% to the same question.[6] → Anchoring bias in trading
- Noticing only what fits your view (confirmation bias): once you think price will rise, you mostly notice reasons it will. → Confirmation bias in trading
- Feeling a loss more than an equal gain (loss aversion): the paper that introduced prospect theory says the pain of losing a sum of money appears to be greater than the pleasure of gaining the same amount.[1] → Loss aversion in trading
How to spot it in your records: next to your reason for entering, note whether you wrote down one point against the trade, and compare the results of trades where you did not.
Why rules you know can be hard to keep
One idea is that when people are calm, they tend to underestimate how they will act when emotions run high (the “hot-cold empathy gap”).[7] That is why rules set while calm can be hard to keep right after a loss. More in Why you break your trading rules.
Three things to check in your records
- Write how you felt and whether you kept your rules, on one line: next to the P&L, note how you felt before entering and whether you followed your rules. → What to write in a trading journal
- Decide “if this happens, I will do that” in advance: a meta-analysis of many studies reported that linking a situation to an action in advance (implementation intentions) helped people reach their goals.[8] For example: “After two losses in a row, I stop for the day.” This is an example, not a recommended number. Choose your own numbers.
- Count once a week: a meta-analysis of studies on monitoring goal progress found a larger effect when progress was recorded.[9] The goals were mostly in areas like health and exercise, not trading. → How to review a month of trading
To see today’s trades, P&L and losing streak next to your own limits, use the daily trading tracker. To turn your limits into amounts, use the daily loss limit calculator. If you are taking a prop firm challenge, recording your current numbers next to your firm’s daily loss and maximum drawdown lines shows how close you are, even when emotions run high. → How prop firm loss limits are measured
About this page
Many of the studies here were done on stocks, futures, casinos, health goals or in the lab, not on forex alone. Most were also done with people in the US and a few other countries, so the effects may differ in other places and cultures. Whether you have these habits, and which ones, differs from person to person. If money or trading is causing you distress, or you find it hard to stop, please don’t carry it alone: talk to someone close to you or a support service where you live.
Sources
- Kahneman, D., & Tversky, A. (1979). Prospect Theory: An Analysis of Decision under Risk. Econometrica, 47(2), 263–291. https://doi.org/10.2307/1914185
- Thaler, R. H., & Johnson, E. J. (1990). Gambling with the House Money and Trying to Break Even: The Effects of Prior Outcomes on Risky Choice. Management Science, 36(6), 643–660. https://doi.org/10.1287/mnsc.36.6.643
- Coval, J. D., & Shumway, T. (2005). Do Behavioral Biases Affect Prices? The Journal of Finance, 60(1), 1–34. https://doi.org/10.1111/j.1540-6261.2005.00723.x
- Croson, R., & Sundali, J. (2005). The Gambler's Fallacy and the Hot Hand: Empirical Data from Casinos. Journal of Risk and Uncertainty, 30(3), 195–209. https://doi.org/10.1007/s11166-005-1153-2
- Barber, B. M., & Odean, T. (2000). Trading Is Hazardous to Your Wealth: The Common Stock Investment Performance of Individual Investors. The Journal of Finance, 55(2), 773–806. https://doi.org/10.1111/0022-1082.00226
- Tversky, A., & Kahneman, D. (1974). Judgment under Uncertainty: Heuristics and Biases. Science, 185(4157), 1124–1131. https://doi.org/10.1126/science.185.4157.1124
- Loewenstein, G. (2005). Hot-cold empathy gaps and medical decision making. Health Psychology, 24(4, Suppl), S49–S56. https://doi.org/10.1037/0278-6133.24.4.S49
- Gollwitzer, P. M., & Sheeran, P. (2006). Implementation Intentions and Goal Achievement: A Meta-analysis of Effects and Processes. Advances in Experimental Social Psychology, 38, 69–119. https://doi.org/10.1016/S0065-2601(06)38002-1
- Harkin, B., Webb, T. L., Chang, B. P. I., Prestwich, A., Conner, M., Kellar, I., Benn, Y., & Sheeran, P. (2016). Does monitoring goal progress promote goal attainment? A meta-analysis of the experimental evidence. Psychological Bulletin, 142(2), 198–229. https://doi.org/10.1037/bul0000025