What anchoring is
A 1974 paper says that in many situations, people make estimates by starting from an initial value and adjusting it to reach an answer.[1] The adjustment is usually not enough, so different starting points give different answers, biased toward the starting value. The paper called this anchoring.[1]
The wheel of fortune experiment
In this paper, people were asked to estimate quantities such as the percentage of African countries in the United Nations.[1] First, a wheel of fortune was spun in front of them to give a number from 0 to 100. They said whether the answer was higher or lower than that number, and then gave their estimate.[1]
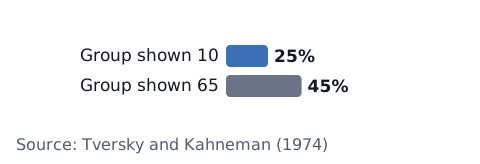
- Group shown 10: median estimate 25%[1]
- Group shown 65: median estimate 45%[1]
- The paper says paying people for accuracy did not reduce the effect[1]
The same paper describes high school students estimating "8×7×6×5×4×3×2×1" or "1×2×3×4×5×6×7×8" within 5 seconds.[1] The median estimate was 2,250 for the descending version and 512 for the ascending version. The correct answer is 40,320.[1] The first few steps of the calculation are thought to have acted as the starting point.
In economic forecasts too
One study looked at expert consensus forecasts of monthly US economic releases.[2] The forecasts were systematically biased toward the values of the previous months' releases.[2]
The study says this fits anchoring, but could also come from the forecasters' own incentives.[2] It also found that bond yields did not react to the part of the forecast error explained by this bias, suggesting market participants already expected it.[2]
Where it can show up in trading
For example (these are our own examples):
- Your entry price: you move the stop loss you had set further away, to "wait until it gets back to my entry"
- A recent high or low: you enter only because "it's cheap compared with the earlier high"
- A past result: you reuse the take-profit distance that worked last time, whatever the market is doing now
Your entry price is simply where you got in; it is not necessarily a special price for the market. For the urge to move a stop loss, see before you move your stop loss, and for research on orders gathering at round numbers, see support and resistance.
Check your own records (you decide)
- Trades where you moved the stop further away: mark trades where you "waited for it to get back to my entry" and compare their results with the rest
- Why you entered: results of trades you took only because of one price, such as "below the earlier high"
- Prices set before entering: write down your stop loss and take profit before you enter, then check later whether you kept to them
The stop loss and take profit calculator shows those prices, the profit and loss calculator shows profit or loss for a price move, and the trading stats calculator shows the numbers in your records. This article does not decide how you should trade.
Sources
- Tversky, A., & Kahneman, D. (1974). Judgment under Uncertainty: Heuristics and Biases. Science, 185(4157), 1124–1131. https://doi.org/10.1126/science.185.4157.1124
- Campbell, S. D., & Sharpe, S. A. (2009). Anchoring Bias in Consensus Forecasts and Its Effect on Market Prices. Journal of Financial and Quantitative Analysis, 44(2), 369–390. https://doi.org/10.1017/S0022109009090127