How the lines are drawn
A common way is to draw a horizontal line through places where price stopped a few times before. But where you measure "stopped" changes the height of the line.
- Along the wick tips (the highs or lows of the candles)
- Along the candle bodies (the opens and closes)
- At round numbers (such as .00 or .50)
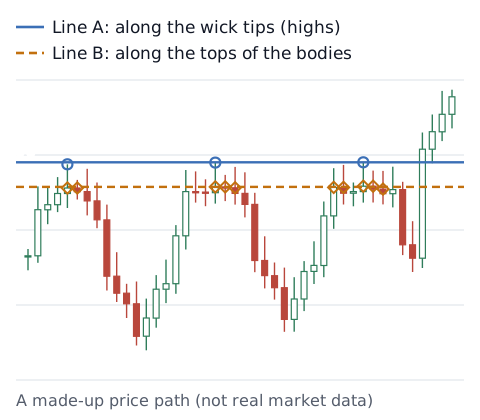
None of these methods is a fixed rule, so two people looking at the same chart often draw different lines. For the basics of reading candles, see how to read candlesticks, and for terms, the glossary.
What research found
One study tested whether the support and resistance levels that currency firms sent to their customers every day actually helped.[1]
- What was tested: levels published daily by six firms (banks and information providers) from January 1996 to March 1998, for the US dollar against the German mark (replaced by the euro in 1999), Japanese yen and British pound, checked against one-minute prices from 9 a.m. to 4 p.m. New York time
- Compared with: levels placed at random (arbitrary) points on the same days (10,000 sets)
- What "bounce" means here: price came within 0.01% of the level and was still on the near side of it 15 minutes later
- Result: after price reached a level, it bounced 60.8% of the time on average at the published levels (a bounce rate, not a win rate) and 56.2% at the arbitrary levels. Price bounced more often at the published levels, and the difference was statistically significant (unlikely to be chance)
- Variation: results differed a lot between firms and between currency pairs. Five business days after publication, the levels still helped, a little less than on the day (statistically significant in 9 of 16 firm-currency pairs)
- Between firms: the firms did not agree much on the levels for a given day. The "strength" ratings that three of the firms attached to their levels were not useful
Note that even arbitrary levels looked like they "worked" more than half the time. Price stopping at a line does not, on its own, show that the line mattered. These are also results from the late 1990s, for three US dollar pairs, six firms, and New York daytime hours only. They may not hold for today's markets or for the lines you draw.
Why price sometimes stops (one explanation)
In another study by the same researcher, using order data from one bank, take-profit orders clustered strongly at round numbers, and stop-loss orders clustered strongly just beyond round numbers. The study reports that this could explain why price tends to stop at round numbers, and why it can speed up after passing through them.[2] This is one explanation, not a rule that always holds.
Check your own lines (you decide)
This article does not decide where to draw lines, or whether to use them. If you use them, log these so you can later see in numbers how your lines worked:
- Where you drew the line (price) and how (highs, bodies, round number, and so on)
- When price reached the line, whether it stopped or went through
- The result of trades you took because of that line
The pivot point calculator and Fibonacci calculator do the math for common levels (they only calculate; they are not trade signals). The trading stats calculator turns a profit and loss list into win rate and average P&L. With few trades, the numbers can swing a lot.
Sources
- Osler, C. L. (2000). Support for Resistance: Technical Analysis and Intraday Exchange Rates. Federal Reserve Bank of New York Economic Policy Review, 6(2), 53–68. https://www.newyorkfed.org/medialibrary/media/research/epr/00v06n2/0007osle.pdf
- Osler, C. L. (2003). Currency Orders and Exchange Rate Dynamics: An Explanation for the Predictive Success of Technical Analysis. The Journal of Finance, 58(5), 1791–1819. https://doi.org/10.1111/1540-6261.00588