How the five lines are calculated
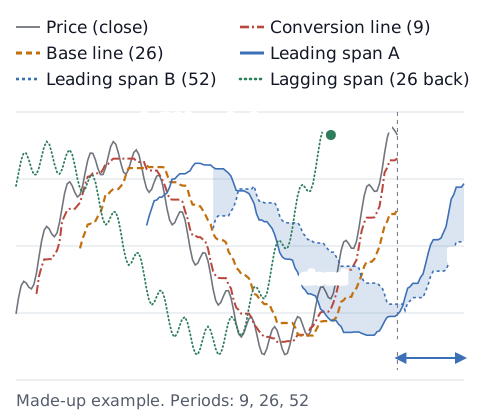
Ichimoku Kinko Hyo is a Japanese name, roughly "one-glance balance chart". Putting the MT5 help description[1] into numbers gives the list below. The help defines the "average price value" for the conversion line as the highest high plus the lowest low, divided by 2, and uses the same term for the base line and leading span B. The periods can be changed. Commonly used periods are 9, 26 and 52, which are also the values in the MQL5 reference example.[2] Other platforms may use different defaults or count the shift slightly differently, so check your own settings. This article covers only how the lines are calculated.
- Conversion line (Tenkan-sen): the highest high plus the lowest low of the last 9 bars, divided by 2 (the middle of the 9-bar range)
- Base line (Kijun-sen): the middle of the last 26 bars' range
- Leading span A (Senkou Span A): the middle between the conversion line and base line, shifted 26 bars ahead
- Leading span B (Senkou Span B): the middle of the last 52 bars' range, shifted 26 bars ahead
- Lagging span (Chikou Span): the latest close, shifted 26 bars back
The shaded area between leading spans A and B is usually called the "cloud".
Why the cloud is drawn ahead
In the chart, the cloud reaches to the right of the latest bar, where there is no price yet. It is easy to read that as "the cloud shows the future". But leading spans A and B are values calculated from past prices, placed 26 bars ahead. No price that has not happened yet goes into them.
In the same way, the lagging span places the latest close 26 bars back, so it can be compared with the price from 26 bars ago.
How it differs from a moving average
A moving average (see SMA vs EMA) is the average of closes over a set number of bars. Ichimoku's conversion and base lines are the middle of the highest high and lowest low over a set number of bars. So as long as the highest high and lowest low stay the same, the line can stay flat (like the flat parts of the base line in the chart). Both are calculated from the past and lag behind price (see why indicators lag).
Check how you use it (you decide)
Many ways of reading Ichimoku are described, such as "price broke through the cloud" or "the conversion and base lines crossed". This article does not decide which to use, or whether to use it at all. If you use it, decide these first and log them, so you can see later how it worked for you:
- What you watch: price versus the cloud, line crosses, the lagging span versus price, and so on
- When you watch: on closed bars only, or during the bar too
- How you log it: put what you watched in the strategy name, like "Ichimoku cloud break"
The trading stats calculator turns a profit and loss list into win rate, average P&L and longest losing streak. With few trades, the numbers can change a lot.
Sources
- MetaQuotes. Ichimoku Kinko Hyo (MetaTrader 5 Help). https://www.metatrader5.com/en/terminal/help/indicators/trend_indicators/ikh
- MetaQuotes. iIchimoku (MQL5 Reference). https://www.mql5.com/en/docs/indicators/iichimoku