8 wins in 10 trades: think in ranges
Your recorded win rate (wins ÷ trades) is what happened. Your true win rate is what you would get if you kept trading the same way under the same conditions for a very long time. The fewer trades you have, the further apart the two can be. If a coin lands heads 7 times in 10 tosses, that does not mean it lands heads 70% of the time.
Statisticians describe this gap with a confidence interval. Put simply, it is the range where your true win rate likely is, given your record. "95%" means that if you build the range this way, about 95 times out of 100 it will contain the true win rate. Here we use the 95% Wilson interval, a method recommended for small samples in a widely cited review.[1][2][3]
- 8 of 10: about 49% to 94%
- 16 of 20: about 58% to 92%
- 80 of 100: about 71% to 87%
- 160 of 200: about 74% to 85%
For 8 of 10, the low end is about 49%. Even a strategy that really wins about 50% of the time will show 8 or more wins in 10 trades about 5.5% of the time (roughly 1 time in 18). A lucky run of ten is still possible.
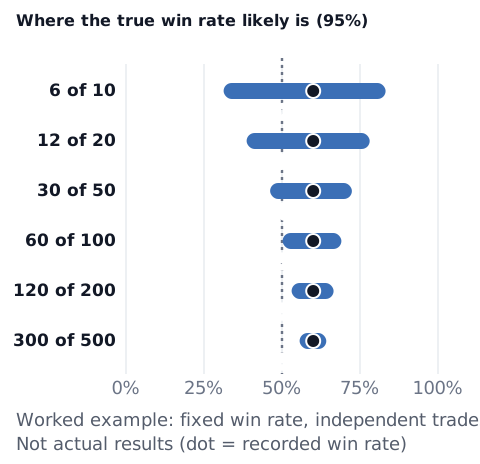
How we calculated it: with the Wilson formula (shown on the win rate confidence interval calculator page, where you can also enter your own trades and wins). Another method, the "exact" Clopper–Pearson interval,[4] gives an even wider range for 8 of 10: about 44% to 97%. Either way, the range after 10 trades is very wide.
Same true win rate, very different records at 20 and 200 trades
Now look at it from the other side. Suppose a strategy has a true win rate of 55% that never changes (an assumed number for the example). At least 95% of the time, its recorded win rate lands in these ranges:
- 20 trades: 35% to 75% (7 to 15 wins)
- 50 trades: 42% to 68%
- 100 trades: 45% to 65%
- 200 trades: 48% to 62% (96 to 124 wins)
- 500 trades: about 51% to 59%
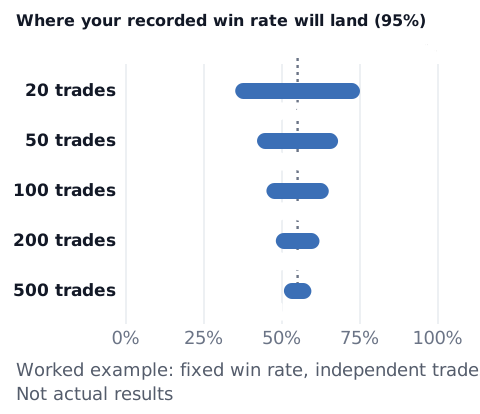
Trading the same strategy the same way, a 20-trade record can make it look like a weak 35% strategy or a strong 75% strategy. Even at 200 trades, the range is still about 14 points wide. Psychologists Amos Tversky and Daniel Kahneman (1971) described a common tendency to expect a small sample to look like the whole, more than it really does.[5]
A few losses, and losing streaks
The same view helps when a few losses make you want to quit. Even with a true win rate of 55%, ending 10 trades with 4 or fewer wins (6 or more losses) happens about 26% of the time, and 3 or fewer wins about 10% of the time (calculated example).
To see how likely a run of losses is, use the losing streak article and the losing streak calculator. This does not mean "keep going, the strategy is fine". It means a small number of trades cannot show whether it is good or bad. In the meantime, it is more useful to check whether those losses followed your rules, or whether some of them came from not following your rules.
How many trades to collect before a review
There is no single "enough". It depends on how big a difference you want to detect. For example, around a 50% record, the range reaches about 13 points above and below at 50 trades, about 10 points at 100 trades, and about 7 points at 200 trades.
| Trades | 95% interval at a 50% record | Above and below |
|---|---|---|
| 20 | about 30–70% | about ±20 points |
| 50 | about 37–63% | about ±13 points |
| 100 | about 40–60% | about ±10 points |
| 200 | about 43–57% | about ±7 points |
| 400 | about 45–55% | about ±5 points |
| 1,000 | about 47–53% | about ±3 points |
(Wilson method, calculated example.) The range shrinks roughly in proportion to 1/√(number of trades), so halving it takes about four times as many trades. If the gap you care about is large (say, 20+ points above your break-even win rate), a few dozen trades may already give you a sense of it. If the gap is small (say, 5 points), even a few hundred trades may not separate it clearly. How many trades to collect is your call, based on these ranges. Deciding in advance "I'll review after N trades", instead of changing your rules after a handful of results, makes the swings easier to live with.
A few things to watch:
- Splitting by conditions shrinks each group. "Mornings only" or "this pair only" each has fewer trades, so each range is wider
- Markets change. This math assumes a fixed win rate. Real win rates do not stay fixed, and pooling records from years ago may mean counting something different from what you trade now
- If you changed your rules partway, counting only the trades after the change gives a closer picture of the current strategy
Look at the reward-to-risk ratio too, not just the win rate
In short: the win rate you need to break even depends on how big your average win is compared with your average loss. Check whether the interval sits above that win rate.
A high win rate can still lose money if the average loss is bigger than the average win. For example, with an average win 1.5 times the average loss (reward-to-risk 1.5 : 1), the break-even win rate is 1 ÷ (1 + 1.5) = 40% (in general, break-even win rate = 1 ÷ (1 + average win ÷ average loss), before spread and commission).
- Example (calculated): 55 wins in 100 trades (55% record) gives an interval of about 45% to 64%. With a 40% break-even, the whole interval sits above it. This describes the past record, not future results; markets change.
If the break-even win rate falls inside the interval, that many trades cannot tell the two apart yet. You can find the break-even win rate for your own numbers with the break-even win rate calculator. Keep in mind that the reward-to-risk ratio is an average too, and it also moves around when trades are few. Spread and commission push the real break-even win rate a little higher.
If you are taking a prop firm challenge
A prop firm challenge is often decided over a few dozen trades. As the table above shows, the win rate range is still wide at that point, so the win rate alone is hard to read. One way to read your record is to look, alongside the win rate, at your average result per trade in R (where 1R is the amount you risk per trade) and at how far you are from the daily loss limit. You can see how far your equity is from the floor with the prop firm drawdown calculator. Firms measure their limits differently, so check your firm's official rules and dashboard.
These calculations do not tell you whether a strategy works or whether to keep trading it. They are a guide to how wide a range to read your numbers with.
References
- Wilson, E. B. (1927). Probable inference, the law of succession, and statistical inference. Journal of the American Statistical Association, 22(158), 209–212. https://doi.org/10.1080/01621459.1927.10502953
- Brown, L. D., Cai, T. T., & DasGupta, A. (2001). Interval estimation for a binomial proportion. Statistical Science, 16(2), 101–133. https://doi.org/10.1214/ss/1009213286
- NIST/SEMATECH. e-Handbook of Statistical Methods, 7.2.4.1 Confidence intervals. https://www.itl.nist.gov/div898/handbook/prc/section2/prc241.htm
- Clopper, C. J., & Pearson, E. S. (1934). The use of confidence or fiducial limits illustrated in the case of the binomial. Biometrika, 26(4), 404–413. https://doi.org/10.2307/2331986
- Tversky, A., & Kahneman, D. (1971). Belief in the law of small numbers. Psychological Bulletin, 76(2), 105–110. https://doi.org/10.1037/h0031322