How the break-even win rate is calculated
The average result per trade can be written like this (our own calculation).
Average result per trade = win rate × average win − loss rate × average loss
If p is the win rate that makes this zero, then p × average win = (1 − p) × average loss, so p = average loss ÷ (average win + average loss) = 1 ÷ (1 + risk-reward).
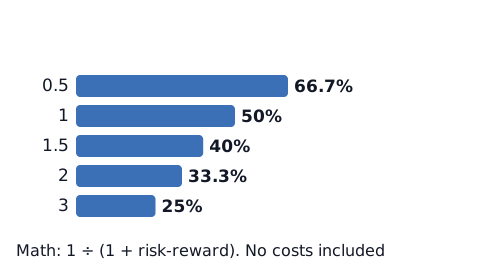
For example, with a 60% win rate but an average win half the size of the average loss (risk-reward 0.5), the break-even win rate is about 66.7%, so the result works out below zero. With a 40% win rate and a risk-reward of 2, the break-even is about 33.3%, so it works out above zero. Likewise, a 75% win rate with a risk-reward of 0.5 is above its break-even of about 66.7% (all before costs, and only if those past averages hold). This is not a recommendation of any combination, and going past the break-even point is not a promise of profit. Win rate and risk-reward are past averages, and with only a few trades, both can swing a lot.
Getting the real numbers from the MT5 report
The MT5 testing report shows numbers like these.[1]
- Profit trades (% of total): the number of trades that made a profit, and their share of all trades
- Average profit trade: total profit divided by the number of winning trades
- Average loss trade: total loss divided by the number of losing trades
- Profit factor: the ratio of gross profit to gross loss; a value of 1 means they are equal
These are testing report numbers, but your real trading records, or any platform or account history that shows average win and average loss, work the same way. Average profit trade ÷ average loss trade (ignoring the minus sign) is your real risk-reward ratio (our own calculation). A profit factor of 1 means gross profit and gross loss are the same, so the result is zero.[1] Profit factor is calculated as gross profit ÷ gross loss (taking the loss as a positive number; our own reading).[2]
Profit trades are trades with a profit and loss trades are trades with a loss, so if some trades closed at exactly zero, the two percentages may not add up to 100% (our own reading).
Why the real ratio differs from your plan
Even if you plan a 20-pip stop and a 40-pip target (risk-reward 2), the real averages often end up different.
- Taking profit early: with a trade in profit, it is tempting to close early, so the average win shrinks
- Moving the stop: moving it further away makes the average loss bigger (see why you move your stop-loss)
- Costs: spread and commission make wins smaller and losses bigger (see counting your trading costs)
Some plans close early on purpose; then it is not a gap. Put your planned risk-reward next to the real one from your records, and you can see where the gap comes from.
Check your own records (you decide)
This article does not decide which risk-reward ratio you should trade. Check it together with your win rate, in your own records:
- The stop and target distances you planned before entering
- Where you actually closed, and how you felt (took profit early, moved the stop, and so on)
- Your win rate and real risk-reward ratio each month
The break-even win rate calculator works out the break-even win rate, and the trading stats calculator turns a profit and loss list into win rate and averages. How often losing streaks happen at a given win rate is covered in losing streaks by the numbers.
Sources
- MetaQuotes. Testing Report (MetaTrader 5 Help). https://www.metatrader5.com/en/terminal/help/algotrading/testing_report
- MetaQuotes. Testing Statistics (MQL5 Reference). https://www.mql5.com/en/docs/constants/environment_state/statistics