At Tiltnote we also test trading rules on historical prices. Some of them looked positive before costs and left nothing once costs were taken out. Others looked good on one-minute bars and disappeared when we re-measured them with tick data (every individual price change). In each case, it was the measuring, not the rules, that produced the "profit". Here are the pitfalls, one at a time.
1. Leave out costs, and losses can look like wins
If you don't subtract the spread, commission and swap, a rule that makes a tiny amount per trade turns into a smooth rising line as trades add up. But the smaller the edge per trade, the more likely costs are to flip the result from positive to negative.
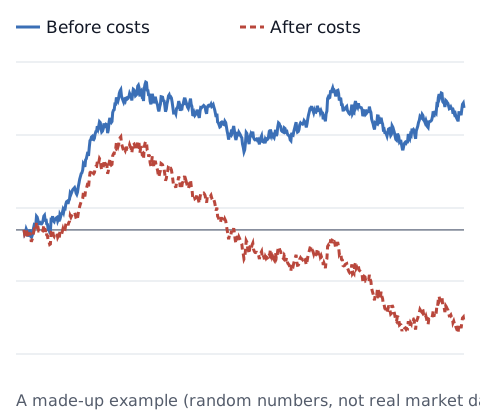
Research shows the same thing on real data. A paper that re-examined technical trading rules on daily Dow Jones Industrial Average prices from 1897 to 2011 found that even in the period used to pick the rules, low transaction costs completely offset their performance.[1] It is a study of a US stock index, and results in forex or other countries' markets may differ. Still, forex also charges you on every trade, so it is worth subtracting costs from your own rules and checking.
When you subtract costs, watch for these:
- Check your tool's settings first: make sure the tool you test with (MT5, TradingView, your broker's platform and so on) actually takes the spread and commission out of the results. In the MT5 Strategy Tester (the built-in tool for testing automated rules on past prices), for example, set the tick generation mode to "Every tick based on real ticks", and check how spread and commission are applied; commission is in the advanced settings, where you can use the account's predefined commissions or enter your own.[6]
- Don't use the average spread: spreads widen around economic data releases, at the weekly reopen and around the daily rollover (the end of the broker's trading day, when open positions are carried over to the next day). If your rules trade at a specific moment, use the spread at that moment, or you will understate the cost
- Both sides of the trade: costs apply when you enter and when you exit. Brokers quote commission either per side (entry or exit alone) or per round trip (both together). If it is per side, subtract it twice for each trade
- Look at swap separately: for rules that hold for days, split the result into the part from price moves and the part from swap, so you can see where the profit actually comes from. On a swap-free account (which some traders use for religious or other reasons), this item does not apply
For how to add up a month of costs, see counting your trading costs.
2. When you can't tell the order inside a bar, fake wins appear
A candlestick only stores four prices: open, high, low and close. If a single bar reached both your take-profit and your stop, the bar alone can't tell you which one was hit first.
The MetaTrader 5 Strategy Tester, for example, can build price movement from one-minute bars. In its "1 minute OHLC" mode (OHLC stands for open, high, low, close), if a bar has more than four ticks, only four prices (open, high, low and close) are generated. The help page says testing on real ticks from the broker is as close to real conditions as possible.[2]
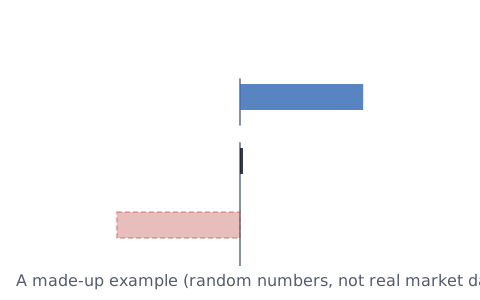
Even a rule with no edge looks profitable if you assume the take-profit came first whenever both were touched. The tighter your take-profit and stop are compared with a typical bar, the bigger this gap gets.
Dropping the unclear bars can make things worse
Leaving out every trade that hit an unclear bar (a bar that touched both the take-profit and the stop, so you can't tell which came first) sounds fair. But if winning and losing trades are not equally likely to hit one, the trades you keep are skewed. Take a rule that moves its exit along as price moves in its favor (a trailing stop): winning trades stay open longer and pass through more bars, so they are more likely to hit an unclear bar and be dropped. Depending on how the rule is built, losers can be the ones dropped more often instead. In our own testing, dropping trades this way once produced results that made no sense. (In the simple example above, with the take-profit and stop the same distance away, dropping them caused almost no skew. Whether it does depends on how the rule is built.)
Safer alternatives:
- Run it both ways, all the way through: count every trade once assuming the favorable price always came first and once assuming the unfavorable price did, and report the range. See whether anything survives the unfavorable case
- Re-test tight rules on tick data: if your take-profit, stop or entry distance is only a few times the spread, don't base your conclusion on bar data
3. Pick the best of many tries, and you are likely picking luck
Trying many settings or rules and keeping the best one is common practice. But the more you try, the better the best result looks, even with no real edge.
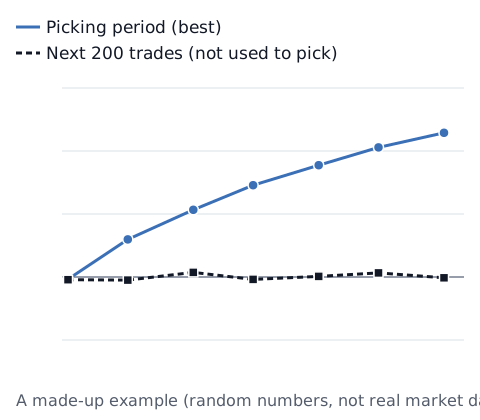
Three findings from research:
- Even with only 10 tries: assuming no rule has a real edge, with one year of data, trying 10 versions gives the best one an expected annualized Sharpe ratio (return divided by how much it swings) of 1.57 in the period used to pick it. In the period not used, its expected result is still zero.[3] There's more on this in why a great backtest can fail live
- Nearly 8,000 rules over 100 years: a study applied 7,846 technical trading rules to daily Dow Jones prices from 1897 to 1996. Even after accounting for how many rules were tested, some rules beat the benchmark over the roughly 90 years from 1897 to 1986. But over the next 10 years, 1987 to 1996, there was little evidence that even the best rule had beaten the benchmark.[4] Both this study and [1] use a US stock index; results in forex or other countries' markets may differ.
- The habit of discounting: a common practice is to cut a backtest's reported Sharpe ratio by 50%, because researchers search through so many possibilities (data mining). One paper argues that a flat 50% is only a rule of thumb and shows how to set the discount based on the number of tests: borderline results get cut heavily, very strong ones only moderately.[5]
What helps:
- Count every try: including the versions you threw away. Versions that only tweak a setting on the same price data give similar results, so treat the number of truly independent tries as smaller than the raw count
- Write down your pass mark first: before you see the results, write what has to be how good to count as a pass. If you set the bar afterward, it tends to fit whatever passed
- Check on data you didn't use: split the data, pick on the first part, and check on the second part once. If you adjust after looking at the second part and check again, you start fitting to that part too
4. Every condition added afterward fits the past a little more
You look back at your losing trades and add rules: skip this hour, take this weekday off, only enter when an indicator is above some level. The past results keep improving. But each condition was chosen after seeing the losses, so of course the past looks better.
- Each condition multiplies the tries: a paper on backtest overfitting gives this example. One setting with two possible values gives 2 versions; add 4 more such settings for 5 in total and you have 2 to the power of 5 = 32, which makes overfitting much more likely. It also says a backtest that does not report how many versions were tried makes the risk of overfitting impossible to judge.[3]
- Fewer trades: each condition removes trades, and results from a small number of trades swing a lot by chance
- Explanations come after the fact: if you work out why a condition helps only after seeing the results, almost any condition can be explained
When you add a condition, put the trade counts before and after side by side, and count the condition as one more try. Write the reason before you look at the results. If the reason is "spreads are wide at this hour", for example, you can actually measure the spread at that hour and check.
5. A short checklist for your own tests
None of this means your strategy is bad. Measure it consistently, and you get to see what it really does. Which strategy to use is up to you. Here is what to check when you look at a backtest.
- Costs: did you subtract spread, commission and swap on both entry and exit, using the spread at the time you trade?
- Order inside a bar: how did you count bars that touched both the take-profit and the stop? Did you run both the favorable and unfavorable case?
- Number of tries: have you written down how many versions you tried, including the ones you dropped?
- Pass mark: did you write it before seeing the results?
- Unused data: do you show results for the period not used to pick, and how many times have you looked at it?
- Added conditions: for each one, do you have the trade counts before and after, and a reason written in advance?
- Number of trades: is it too small? Does most of the profit come from a handful of trades?
- Too-good results: if profit comes easily at many times the cost, did you check your own calculation first?
Once you trade live, measure live results the same way (profit and loss after costs). The trading stats calculator turns a profit and loss list into win rate, average P&L and longest losing streak. If the backtest and live numbers drift apart, the list above is a place to start looking for why.
Sources
- Bajgrowicz, P., & Scaillet, O. (2012). Technical trading revisited: False discoveries, persistence tests, and transaction costs. Journal of Financial Economics, 106(3), 473–491. https://doi.org/10.1016/j.jfineco.2012.06.001
- MetaQuotes. Real and Generated Ticks (MetaTrader 5 Help). https://www.metatrader5.com/en/terminal/help/algotrading/tick_generation
- Bailey, D. H., Borwein, J. M., López de Prado, M., & Zhu, Q. J. (2014). Pseudo-Mathematics and Financial Charlatanism: The Effects of Backtest Overfitting on Out-of-Sample Performance. Notices of the American Mathematical Society, 61(5), 458. https://doi.org/10.1090/noti1105 (authors' copy: https://www.davidhbailey.com/dhbpapers/backtest-pseudo.pdf)
- Sullivan, R., Timmermann, A., & White, H. (1999). Data-Snooping, Technical Trading Rule Performance, and the Bootstrap. The Journal of Finance, 54(5), 1647–1691. https://doi.org/10.1111/0022-1082.00163 (earlier version: https://www.fmg.ac.uk/sites/default/files/2020-11/dp303.pdf)
- Harvey, C. R., & Liu, Y. (2015). Backtesting. The Journal of Portfolio Management, 42(1), 13–28. https://doi.org/10.3905/jpm.2015.42.1.013 (authors' copy: https://people.duke.edu/~charvey/Research/Published_Papers/P120_Backtesting.PDF)
- MetaQuotes. Strategy Testing (MetaTrader 5 Help). https://www.metatrader5.com/en/terminal/help/algotrading/testing