Losing streak chances by win rate and number of trades
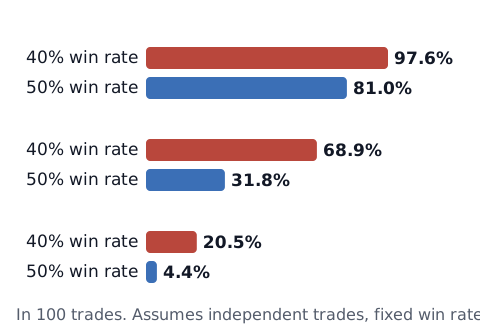
We assume each result does not affect the next one (each trade is independent) and your win rate stays the same. Here is the chance of at least one streak of N or more losses.
- 35% win rate: 5+ in a row 99.5%, 7+ 85.0%, 10+ 36.8%
- 40% win rate: 5+ in a row 97.6%, 7+ 68.9%, 10+ 20.5%
- 45% win rate: 5+ in a row 92.0%, 7+ 49.7%, 10+ 10.1%
- 50% win rate: 5+ in a row 81.0%, 7+ 31.8%, 10+ 4.4%
- 60% win rate: 5+ in a row 45.9%, 7+ 8.9%, 10+ 0.6%
- 50% win rate: 5+ in a row 96.6%, 7+ 54.4%, 10+ 9.0%
- 60% win rate: 5+ in a row 71.4%, 7+ 17.5%, 10+ 1.2%
The more you trade, the closer a long losing streak comes to being something to plan for than rare bad luck. You can run your own win rate and number of trades in the losing streak calculator.
How it is calculated: we find the exact probability by tracking the current losing streak trade by trade (dynamic programming). The win rate is an assumption you enter, for example from your own records. This only counts wins and losses. It does not include how big each win or loss is (your reward-to-risk ratio). Strategies that aim for large wins sometimes have lower win rates, and as the table shows, a lower win rate means longer streaks are more likely. You can check how win rate and reward-to-risk work together with the break-even win rate calculator. How far the win rate in your own record can be trusted, and after how many trades, is covered in how far can you trust your win rate?
A streak alone doesn’t tell you if a strategy works
Even with the same win rate, long streaks show up naturally over many trades. So the length of a streak alone can’t tell you that your strategy is broken, or that it is fine. On the other hand, real win rates are not fixed, and the numbers above assume your win rate doesn’t change.
During a streak, these questions are more useful:
- Were the losing trades taken by your own rules?
- Did you start increasing size, or take setups that didn’t meet your rules, partway through?
- Were you trading at unusual times, or on pairs you don’t usually trade?
What you review depends on whether the streak was losses that followed your rules, or losses mixed with trades where your process slipped.
Under this assumption, the numbers don’t say the next trade will win either
If one result doesn’t affect the next, your chance of winning the next trade after a streak is the same as before it. People tend to expect small samples to look like the long-run average (even among research psychologists surveyed).[1] “I’ve lost five, so the next one will win” is one form of that. The reverse, “I’m on a bad run, so the next one will lose too,” isn’t supported under this assumption either. If you feel the urge to increase your size after a streak, see how to stop revenge trading.
How much a streak takes from your account
How much a streak costs depends on what percentage of your balance you risk per trade. These figures assume you always risk the same percentage of your current balance:
- 1% per trade: 5 losses in a row is −4.9%, 10 is −9.6%
- 2% per trade: 5 losses in a row is −9.6%, 10 is −18.3%
- 5% per trade: 5 losses in a row is −22.6%, 10 is −40.1%
(Because the balance shrinks after each loss, the total is slightly less than a simple multiplication.) People risk different percentages. These figures only show the math; they are not a recommended amount.
If your account has a point where you have to stop, you can compare it with the streak lengths in the probability tables at the top to see roughly how many losses in a row it would take to get there. On a prop firm account, that is the firm’s maximum drawdown. If you don’t use a prop firm, use the maximum loss you have set for yourself. (If the limit is measured from your starting balance, the figures above will differ slightly.) The daily loss limit calculator shows how many losses at your risk per trade it takes to reach your daily limit.
What to decide before a streak
Even when you know streaks will happen, they still shake you in the moment. So decide before one starts. The numbers below are only an example. Set your own from your records and the tables above.
- If I lose 3 in a row → I take a 30-minute break
- If I lose 5 in a row → I’m done for the day
- After a streak → I keep my size the same (no increase)
- If the streak continues → I review my log and check whether the losses followed my rules
If trading losses are affecting your money, sleep or relationships, consider talking to someone you trust, or to a local support service for gambling or other addictions.
Sources
- Tversky, A., & Kahneman, D. (1971). Belief in the law of small numbers. Psychological Bulletin, 76(2), 105–110. https://doi.org/10.1037/h0031322