What is a drawdown?
A drawdown is how far your account balance (or equity, which is your balance plus open profit or loss) has fallen from its highest point. The biggest fall from a high point to the lowest point after it is called the maximum drawdown. In this article, “drawdown” or “loss” means the percentage you lost from that high point.
Why getting back takes more than you lost
A loss is measured against your bigger, earlier balance. A gain is measured against your smaller, current balance.
Say your balance is 100. After a 50% loss it is 50. To get from 50 back to 100, you need to add 50. That is 50 ÷ 50 = +100% of your current balance.
As a formula:
- 20% loss (0.2): 1 ÷ 0.8 − 1 = 0.25 → +25%
- 50% loss (0.5): 1 ÷ 0.5 − 1 = 1.0 → +100%
It is easy to think that losing 20% and then gaining 20% gets you back to even. It does not. 100 minus 20% is 80, and 80 plus 20% is only 96. To get from 80 back to 100, you need +25%.
Gain needed, by size of loss
This table applies the formula above to each size of loss. The two columns on the right use an account of 10,000 as an example (an example only, not a recommended amount; the currency can be USD, EUR, GBP or any other, and the percentages are the same). The amount you need to win back always equals the amount you lost.
Swipe the table sideways to see all columns →
| Loss | Gain needed to get back | Example: balance after the loss | Example: amount to win back |
|---|---|---|---|
| 5% | +5.3% | 9,500 | 500 |
| 10% | +11.1% | 9,000 | 1,000 |
| 20% | +25% | 8,000 | 2,000 |
| 30% | +42.9% | 7,000 | 3,000 |
| 40% | +66.7% | 6,000 | 4,000 |
| 50% | +100% | 5,000 | 5,000 |
| 60% | +150% | 4,000 | 6,000 |
| 75% | +300% | 2,500 | 7,500 |
| 90% | +900% | 1,000 | 9,000 |
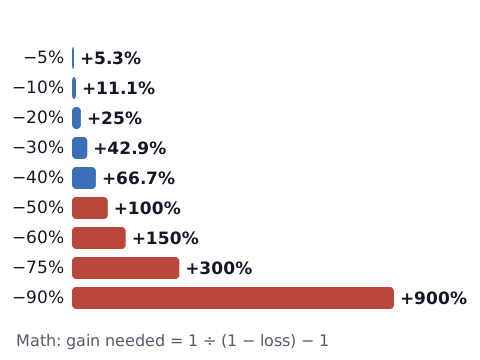
Up to a 10% loss, the gain needed is only a little more than 1 point above the loss. Past that, the gap keeps widening: the gain needed is 2 times the loss at 50%, 4 times at 75% and 10 times at 90%. You can check your own numbers with the drawdown recovery calculator. (This math does not include deposits, withdrawals or fees.)
Worked examples
The numbers are examples, not recommended amounts or percentages.
- The balance is $8,000. The loss is $2,000.
- To get back to $10,000, you need $2,000 on top of $8,000. That is +25%.
- The balance is $5,000. The loss is $5,000.
- To get back, you need $5,000 on top of $5,000. That is +100%, which means doubling the balance.
The amount to win back equals the amount you lost. But because your balance is now smaller, the same amount is a bigger percentage of it.
The risk of raising your lot size to win it back
When you see how big the needed gain is, it is tempting to trade bigger to get back faster. One thing to keep in mind: a bigger lot (trade size) magnifies losses by the same factor as profits. The bigger the gain you need, the bigger the lot it seems to call for, but the percentage you lose on a losing trade grows in the same way.
Here is a comparison using five losses in a row. The account went from $10,000 (an example) down 50% to $5,000. Both lines assume the loss on each trade is always the same percentage of your current balance.
- Each loss is 1% of the balance: after 5 losses in a row the balance is about $4,755 (−4.9%). To get back to the $5,000 you had before the streak, you need +5.2%.
- Each loss is 5% of the balance: after 5 losses in a row the balance is about $3,869 (−22.6%). To get back to the $5,000 you had before the streak, you need +29.2%.
(These are examples, not recommended percentages.) After a big loss, you are already further from your old balance. A further loss makes the gain you need grow even faster.
Trying to win back a loss by breaking your own rules, for example by trading outside your plan or by increasing your size, is often called revenge trading. Why it happens, and the if-then rules you can set in advance, are in how to stop revenge trading.
How a smaller risk per trade changes a drawdown
The percentage of your balance you lose on each trade decides how far a losing streak takes you, and how big a gain you need afterward. The table below shows the result after losing streaks, when each loss is always the same percentage of your current balance. The numbers are examples, not recommended percentages.
Swipe the table sideways to see all columns →
| Loss per trade | After 5 losses in a row | After 10 losses in a row | After 20 losses in a row |
|---|---|---|---|
| 1% | −4.9% (needs +5.2% to get back) | −9.6% (+10.6%) | −18.2% (+22.3%) |
| 2% | −9.6% (+10.6%) | −18.3% (+22.4%) | −33.2% (+49.8%) |
| 5% | −22.6% (+29.2%) | −40.1% (+67.0%) | −64.2% (+179.0%) |
You can also work out how many losses in a row it takes to reach a 50% drawdown (when each loss is the same percentage of your current balance):
- 1% per trade: 69 losses in a row
- 2% per trade: 35 losses in a row
- 5% per trade: 14 losses in a row
With a smaller percentage per trade, the same streak takes less from your account, and the gain needed to get back is smaller too. With a larger percentage, even a few losses in a row can mean a deep drawdown. (This only counts losses. When the loss per trade is smaller, the profit per trade is often smaller too.)
Losing streaks happen even at a 50% win rate. The chance of at least one streak of 5 or more losses in 100 trades is about 81% (assuming a fixed win rate and independent trades). More is in losing streaks, in numbers.
A daily loss limit puts a ceiling on how much one day can take. How to choose one is in how to set a daily loss limit, and the daily loss limit calculator shows how many losses it takes to reach it.
Your own maximum drawdown comes from your records
If you have a record, you can calculate your maximum drawdown. Go through your balances in order. At each point, find the gap between the highest balance so far and the current balance, as a percentage of that highest balance. The largest gap is your maximum drawdown.
- Balances in order: 10,000 → 10,800 → 9,720 → 10,200 → 9,500 → 10,900 (in any currency)
- From 10,800 down to 9,720 is a fall of 1,080, or 10.0% of 10,800.
- From 10,800 down to 9,500 is a fall of 1,300, or about 12.0% of 10,800.
- The maximum drawdown of this record is about 12.0% (10,800 → 9,500).
A longer record can show a deeper maximum drawdown. The maximum drawdown of a short record only describes that period.
If you save your MT4/MT5 trade history and paste the profit column into the trading stats calculator, you get the largest drop and other numbers in one step. How to export your history is in export and review your MT4/MT5 trade history, and what to record is in what to write in a trading journal. Along with the numbers, it helps to look at whether you kept your rules, and whether your size changed, during the period when the account dropped most.
What to decide in advance
The items below are only an example. Set your own from your records and the tables above.
- I lose at most ○% of my balance on one trade (a percentage of my current balance)
- If my balance falls ○% from its high, I stop for the day and review my log
- After a big drop, I do not raise the percentage I risk per trade
- I work out the gain needed to get back before deciding what to do next
If trading losses are affecting your money, sleep or relationships, consider talking to someone you trust, or to a local support service for gambling or other addictions.