How an SMA is calculated
An N-period SMA adds up the latest N closes, including the current bar, and divides by N.[1] In a 20-period SMA, each of the 20 closes gets 1 ÷ 20 = 5% of the weight. Anything older than that gets no weight at all.
How an EMA is calculated
An EMA takes the previous EMA and mixes in a little of the current close.[1]
EMA now = close now × α + previous EMA × (1 − α)
α = 2 ÷ (N + 1)
α = 2 ÷ (N + 1) is the common choice (the MT5 help page gives the formula but not how α is set). For a 20-period EMA, α = 2 ÷ 21, about 9.5%. The current close gets about 9.5%, the bar before about 8.6%, the one before that about 7.8%, and so on, a little less each time. The weight never quite reaches zero, so prices older than 20 bars still count a little (by our calculation, all closes before the latest 20 together carry about 13.5%).
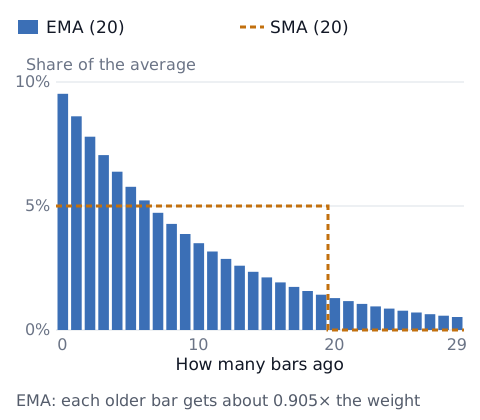
The rough lag is about the same
When price rises in a straight line, an N-period SMA and an EMA with α = 2 ÷ (N + 1) both lag by about (N − 1) ÷ 2 bars (see the math in why indicators lag). An EMA is not lag-free.
The differences show up when price changes direction and when one bar moves a lot.
At a turn, the EMA tends to turn first
Because an EMA weights new prices more, it tends to turn sooner than an SMA when price turns. In the made-up price path below, the EMA turned down 7 bars after price turned, and the SMA 10 bars after.
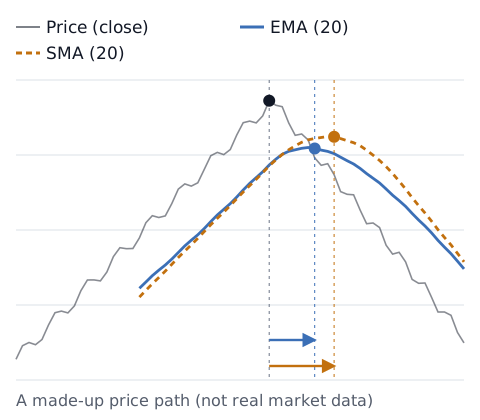
Turning sooner is not only a plus. The EMA also reacts more to small ups and downs, so in sideways markets it can flip direction more often (the same issue as false signals, or whipsaws, in golden and death crosses).
After one spike bar, an SMA moves twice
An SMA has a behavior an EMA does not. One big spike bar pushes the SMA when it enters the average, and moves the line again N bars later, when that price drops out. The SMA moves even if price is doing nothing at that moment.
In an EMA, the spike's weight fades a little each bar, so the line returns slowly and smoothly.
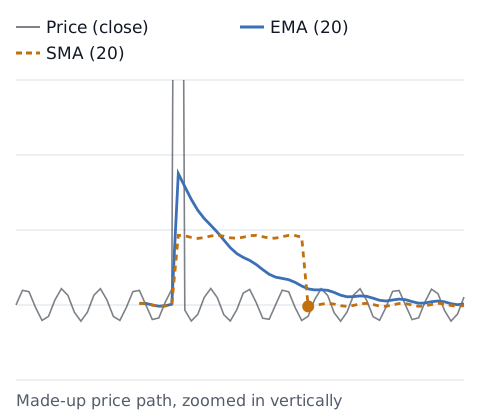
When an SMA suddenly changes direction, the line alone cannot tell you whether that came from the current move or from an old price dropping out. Checking for a big bar N bars back makes it easier to tell.
Other types in MT5
Most charting platforms offer SMA and EMA, though names and options vary. Here is MT5 as an example. Besides SMA and EMA, the MT5 moving average also offers the smoothed moving average (SMMA) and the linear weighted moving average (LWMA).[1] Like an EMA, an LWMA gives newer prices more weight, but the weight falls by a fixed step and nothing older than N bars is included.
Which to use (you decide)
Which works better depends on the market, timeframe and how you use it, so this article does not pick one. What we can say is how they behave:
- SMA: simple to understand. Also moves when an old price drops out
- EMA: tends to turn sooner at a turning point, and reacts more to small ups and downs
- Both: a longer period gives a smoother line and more lag
If you use one, put the type and period in your strategy name, like "SMA 20" or "EMA 20", so you can compare later how each worked for you. The trading stats calculator turns a P&L list into win rate, average P&L and longest losing streak. With few trades, the numbers can swing a lot.
Sources
- MetaQuotes. Moving Average (MetaTrader 5 Help). https://www.metatrader5.com/en/terminal/help/indicators/trend_indicators/ma