How Bollinger Bands are calculated
The MT5 help calculates Bollinger Bands like this.[1]
Middle line = SMA (simple moving average, 20) of close
Upper line = middle line + 2 × standard deviation
Lower line = middle line − 2 × standard deviation
The standard deviation is a number for how far the last 20 closes are spread out around their average. The more spread out those 20 prices are, the bigger the standard deviation and the wider the band. The period (20) and multiplier (2) can be changed in the settings. The exact way the standard deviation is calculated (what it divides by) can differ a little between platforms (MT5 divides by the number of bars, 20), so the same settings can give slightly different lines.
Why the band widens and narrows
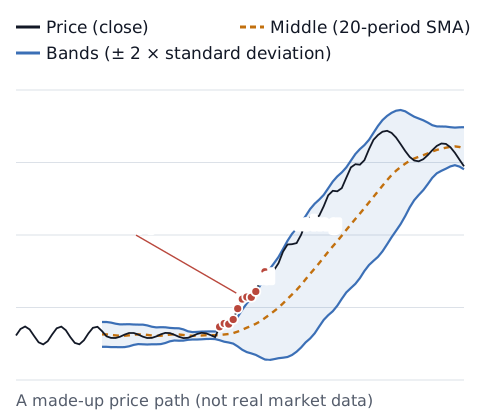
When price moves little, as on the left of the chart, the standard deviation is small and the band is narrow. When price starts to move a lot, the standard deviation grows and the band widens. A narrow band means "recent moves were small". It does not tell you which way price will move next.
Touching a band does not always mean a reversal
You may read that "about 95% of prices stay within the ±2 lines". That figure comes from assuming prices follow a normal distribution (a neat bell-shaped spread). Real price moves may not follow that shape, and the lines are drawn from the past 20 bars, so they do not tell you the chance that future prices will stay inside.
In a strong rise, as from the middle of the chart onward, bars can close above the upper band again and again while price keeps rising. Treating a touch of the upper band as "gone too far", or a touch of the lower band as "oversold", can mean trading against a strong move. Like other indicators, the bands are calculated from the past and lag behind price (see why indicators lag).
Check how you use them (you decide)
This article does not decide whether to use Bollinger Bands, or which settings or approach to use. If you use them, decide these first and log them, so you can see later how they worked for you:
- What you watch: a touch, a bar closing outside the band, or changes in width
- Which direction: whether you trade for a move back toward the middle, or for a move that keeps going
- How you log it: put the settings in the strategy name, like "BB 20/2"
The trading stats calculator turns a profit and loss list into win rate, average P&L and longest losing streak. With few trades, the numbers can swing a lot. For other indicators, see how common indicators work, RSI explained and MACD explained.
Sources
- MetaQuotes. Bollinger Bands (MetaTrader 5 Help). https://www.metatrader5.com/en/terminal/help/indicators/trend_indicators/bb