How the RSI is calculated
The RSI compares the average of upward price changes (U) with the average of downward price changes (D).[1] The change is usually measured from one close to the next (a bar is one candle on the chart).
RS = U ÷ D (average up move ÷ average down move)
RSI = 100 − 100 ÷ (1 + RS)
We split the MT5 help formula into two steps and call the first one RS, to make it easier to follow.
For example, if over the last 14 bars the average up move was twice the average down move, RS = 2 and RSI = 100 − 100 ÷ 3 ≈ 66.7. If up and down moves were the same size, the RSI is 50. If price rose on all 14 bars, it gets close to 100 (our own calculation).
The way the averages are taken (how far back, and with what weights) can differ a little between platforms. So with the same period, the RSI can show slightly different numbers on different charting platforms.
What the 70 and 30 lines describe
Above 70 means up moves were much bigger than down moves recently. From the formula, an RSI of 70 means RS is about 2.3: the average up move was about 2.3 times the average down move (our own calculation).
That is not a forecast that price "went up too much and will fall soon". In a sideways market, price can also fall back after the RSI goes above 70. You cannot know in advance which will happen. In a strong rise, the RSI can stay above 70 for a long time.
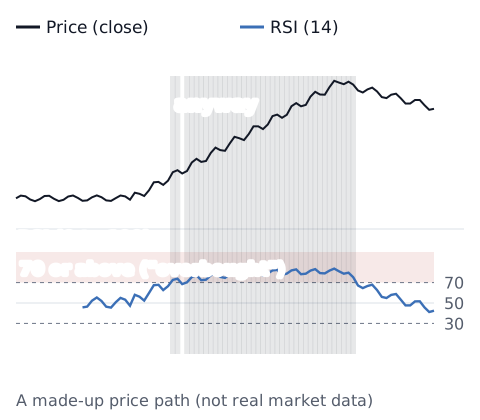
In the same way, in a strong fall the RSI can stay below 30 for a long time. Buying because "it dropped below 30, so it should go up" can mean buying while price keeps falling.
The RSI is also calculated from the past
The RSI is calculated only from past changes in the close. Future prices are not in it (see why indicators lag). The MT5 help also says the RSI usually forms its tops and bottoms before the price chart does.[1] Either way, you only know a top or bottom has formed after the fact, not in advance. A longer period gives a smoother line that reaches 70 or 30 less often. A shorter period crosses 70 and 30 more often.
Also, the RSI on the current bar keeps moving with price until the bar closes. It can go above 70 during a bar and be back below 70 when the bar closes.
Check how you use it (you decide)
This article does not decide whether to use the RSI, or which period or levels. If you use it, decide these first and log them, so you can see later how it worked for you:
- What you watch: crossing 70 or 30, or coming back from them
- When you watch: on closed bars only, or during the bar too
- How you log it: put the period and level in the strategy name, like "RSI 14 / 70"
The trading stats calculator turns a profit and loss (P&L) list into win rate, average P&L and longest losing streak. The break-even win rate calculator shows the win rate you need to break even. With few trades, the numbers can swing a lot. For other indicators, see how common indicators work.
Sources
- MetaQuotes. Relative Strength Index (MetaTrader 5 Help). https://www.metatrader5.com/en/terminal/help/indicators/oscillators/rsi