How MACD is calculated
The MT5 help calculates MACD and its signal line like this.[1]
MACD = EMA (12) of close − EMA (26) of close
Signal = SMA (9) of MACD
An EMA (exponential moving average) gives newer prices more weight (see SMA vs EMA). How the signal line is averaged differs between platforms, and some use an EMA. So with the same settings, the signal line can look slightly different on different platforms.
Some platforms also show MACD as bars (a histogram). Whether the bars show MACD itself or the gap between MACD and its signal line differs by platform, so check your platform's help.
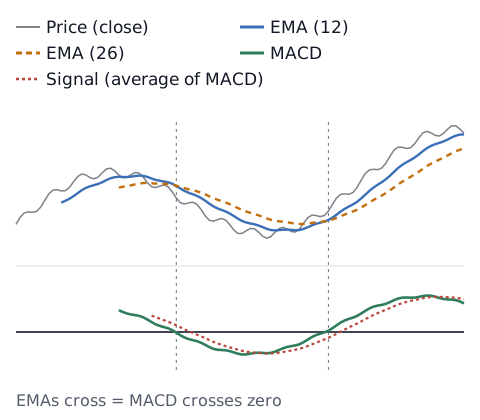
Crossing zero = the two EMAs crossing
Because MACD is the gap between two EMAs, MACD is zero exactly when the two EMAs are equal. So MACD crossing above zero is the same moment as the 12-period EMA crossing above the 26-period EMA. For more on moving average crosses, see golden cross and death cross.
A cross between MACD and its signal line is where MACD crosses its own average. Both kinds of cross tend to happen several times in a short span when the market moves sideways.
How much it lags
MACD is built from EMAs, so it lags like they do (see why indicators lag). In a straight-line move, the rough lag is about 5.5 bars for the 12-period EMA and about 12.5 bars for the 26-period EMA. The signal line averages MACD over 9 more bars, adding roughly another 4 bars of lag (all from (N − 1) ÷ 2, our own calculation). Roughly, the 26-period EMA moves about 12 bars behind price.
Its size depends on the currency pair
MACD is a price difference, so its size depends on the price level of the pair. A pair quoted around 150 (such as yen pairs) and one quoted around 1 can make similar moves in percentage terms, yet show MACD values of very different sizes. So a rule like "MACD above X is big" does not work across different pairs or timeframes.
Check how you use it (you decide)
This article does not decide whether to use MACD, or which settings or crosses to watch. If you use it, decide these first and log them, so you can see later how it worked for you:
- What you watch: crossing zero, or crossing the signal line
- When you watch: on closed bars only, or during the bar too
- How you log it: put the settings in the strategy name, like "MACD 12/26/9"
The trading stats calculator turns a profit and loss list into win rate, average P&L and longest losing streak. With few trades, the numbers can swing a lot. For other indicators, see how common indicators work and RSI explained.
Sources
- MetaQuotes. MACD (MetaTrader 5 Help). https://www.metatrader5.com/en/terminal/help/indicators/oscillators/macd