Why indicators lag
A moving average is the average of the last few closes. A 20-period simple moving average adds up the latest 20 closes, including the current bar, and divides by 20.[1] Older prices carry the same weight as the latest one, so the line moves behind the current price.
RSI, MACD, Bollinger Bands and others are also calculated from past prices or from moving averages (see how common indicators work). Anything calculated from the past lags to some degree. That is not a sign of bad settings. It comes from how the calculation works.
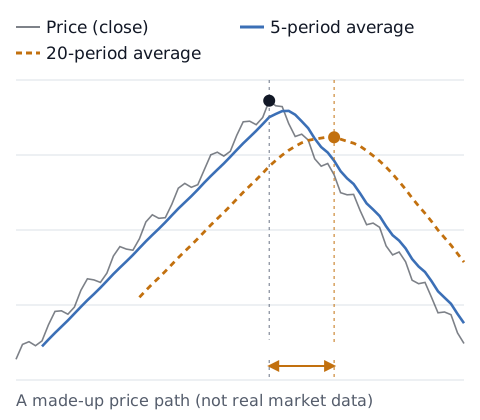
How much lag to expect
The average age of the N prices in a simple moving average is (0 + 1 + … + (N − 1)) ÷ N = (N − 1) ÷ 2 bars. So when price rises in a straight line, the average sits at about the price from (N − 1) ÷ 2 bars ago. For an exponential moving average (EMA) with the common factor α = 2 ÷ (N + 1), the weighted average age is (1 − α) ÷ α, which is also (N − 1) ÷ 2 bars (both are our own calculations).
| Period | Rough lag (bars) | On 5-minute bars | On 1-hour bars | On daily bars |
|---|---|---|---|---|
| 5 | 2 | 10 minutes | 2 hours | 2 trading days |
| 20 | 9.5 | about 48 minutes | 9.5 hours | 9.5 trading days |
| 50 | 24.5 | about 2 hours | about 1 day | 24.5 trading days |
| 200 | 99.5 | about 8 hours | about 4 days | 99.5 trading days |
Scroll the table sideways to see all columns. Days count only the time the market is open.
This is a guide for a straight-line move. Real prices bend and pause, so the lag changes from moment to moment. But one trade-off never goes away: a longer period gives a smoother line and more lag. A shorter period lags less, but reacts to small wiggles and flips direction more often.
Why signals arrive "late"
If you use the direction of a moving average, or a crossover, as a signal, the signal comes after price has already moved. In the chart above, it takes about 10 bars for the 20-period line to turn down after price turns, and price falls a fair way in that time.
There is a second source of delay: the current bar keeps changing until it closes. Indicator values on the current bar update with every price move. A signal that appears mid-bar can be gone when the bar closes. Whether you act on closed bars or on the live bar changes where you enter.
Why sudden moves leave indicators behind
After economic data releases and similar events, price can move a long way in a short time. A study of US dollar exchange rates against five major currencies (January 1992 to December 1998, five-minute data) found that when US data releases differed from expectations, prices jumped right after the announcement.[2]
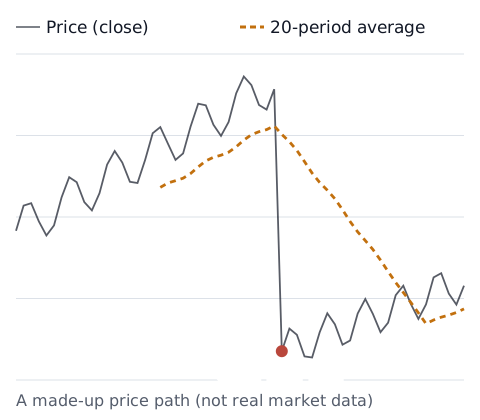
An average dilutes one big move. So the sharper the move, the wider the gap between the indicator and price. By the time the indicator turns, much of the move may be over. In fast moves, spreads can widen and orders can fill at worse prices than expected too (see counting your trading costs).
Living with lag (your call)
You cannot remove lag. What you can do is know how big it is, and count how far your own entries drift.
- Turn lag into time: use the table above to see how many hours of lag your period and timeframe imply
- Decide when you read signals: on closed bars only, or on the live bar too, decided in advance
- Know scheduled release times: check the official release calendars published by national statistics offices and central banks. You can see which markets are open in forex market hours
- Log the gap: in each trade's note, write when the signal appeared, when you actually entered, and how you felt (rushed, patient, and so on). After a week or so, you will see how late, or how early, you tend to be
Which periods or indicators to use, if any, is your decision. Once you have a P&L list, the trading stats calculator sums it up into win rate and average P&L.
Sources
- MetaQuotes. Moving Average (MetaTrader 5 Help). https://www.metatrader5.com/en/terminal/help/indicators/trend_indicators/ma
- Andersen, T. G., Bollerslev, T., Diebold, F. X., & Vega, C. (2003). Micro Effects of Macro Announcements: Real-Time Price Discovery in Foreign Exchange. American Economic Review, 93(1), 38–62. https://doi.org/10.1257/000282803321455151