Moving averages and crosses
A moving average is a line made by averaging the last few closes (see how common indicators work). A short-period line stays close to price; a long-period line moves slowly.
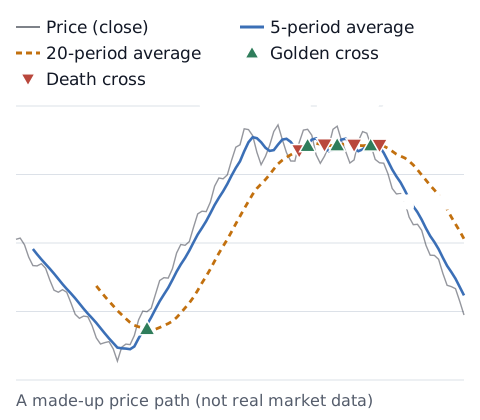
When price keeps rising, the short line rises first and eventually moves above the long line. That is a golden cross. When price keeps falling, the short line drops first and moves below the long line. That is a death cross.
Common period pairs
There is no fixed pair. For daily stock charts, "50 and 200 days" is a common example. In forex, traders use many pairs such as 5 and 20 or 20 and 50, depending on the timeframe. Changing the pair changes how often and when crosses appear. Which pair works better depends on the market and the period, and this article does not pick one.
Why crosses come late
A moving average is an average of past prices, so it moves behind price. An N-period simple moving average lags by roughly (N − 1) ÷ 2 bars (see why indicators lag). A cross is where two lagging lines swap places, so a cross appears after price has already moved a fair way. In the chart, the golden cross appears well above the low.
Why crosses flip back and forth (whipsaws)
When price moves sideways without a clear direction, the short and long lines stay close together. So, as in the sideways part of the chart, golden and death crosses can appear several times in a short span. When price does not follow through after a cross, people often call it a whipsaw or false signal. A longer period gives fewer crosses, but each one arrives even later.
What research has found
How rules like moving average crosses would have performed has been studied for a long time, and the findings are not all the same.
- A well-known study using the Dow Jones Industrial Average (1897–1986) reported strong support for simple moving average and trading range rules: returns after buy signals were higher than after sell signals.[1]
- A later study of the same Dow data accounted for data snooping, the problem that picking the "best" rule from many similar ones can look good by chance. Good performance held up for 1897–1986, but in a later period (1987–1996) it found no clear evidence of superior performance.[2]
- A study that re-tested earlier technical rules on later currency market data reported that the excess returns of the 1970s and 1980s were genuine, but that for filter and moving average rules these profit opportunities had disappeared by the early 1990s.[3]
These are results for specific past markets and periods. They may not hold in the future. Whether and how you use crosses is your decision.
Check against your own records
If you trade crosses, tag those trades in your log so you can see in numbers how they work for you. Paste your P&L into the trading stats calculator for win rate, average P&L and longest losing streak. See how likely losing streaks are with the losing streak calculator, and the win rate you need to break even with the break-even win rate calculator. With few trades, the numbers can swing a lot.
Sources
- Brock, W., Lakonishok, J., & LeBaron, B. (1992). Simple Technical Trading Rules and the Stochastic Properties of Stock Returns. The Journal of Finance, 47(5), 1731–1764. https://doi.org/10.1111/j.1540-6261.1992.tb04681.x
- Sullivan, R., Timmermann, A., & White, H. (1999). Data-Snooping, Technical Trading Rule Performance, and the Bootstrap. The Journal of Finance, 54(5), 1647–1691. https://doi.org/10.1111/0022-1082.00163
- Neely, C. J., Weller, P. A., & Ulrich, J. M. (2009). The Adaptive Markets Hypothesis: Evidence from the Foreign Exchange Market. Journal of Financial and Quantitative Analysis, 44(2), 467–488. https://doi.org/10.1017/S0022109009090103