How true range is measured
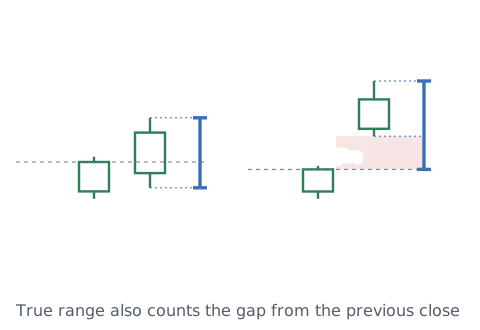
ATR is built from each bar's "true range". The MT5 help defines true range as the largest of these three.[1]
Difference between current high and current low
Difference between previous close and current high
Difference between previous close and current low
Each difference is taken as a size, without a minus sign.
Most of the time, true range is just high minus low. The difference shows when a bar opens with a gap from the previous close. A gap means the next bar (one candle) starts at a price away from the previous close, for example after the market's weekly close or a big news release. Then the gap counts too, so true range is larger than the bar's own high minus low.
How ATR is calculated
ATR is a moving average of true range over a chosen number of bars.[1] A moving average is the average of the latest chosen number of bars, worked out again as each new bar arrives. For example, if the true ranges of the last 3 bars were 20, 30 and 40 pips, a 3-bar ATR is 30 pips (a made-up example). With a period of 14, the average true range of the last 14 bars is a rough "how far one bar moves". The way the average is taken can differ a little between platforms, so the same period can give slightly different numbers.
What ATR can and cannot tell you
- It can tell you: roughly how far recent bars moved. A bigger number means bigger price moves
- It cannot tell you: whether price will go up or down (ATR has no direction)
- It cannot tell you: whether moves will stay this size (it is a past average, so when things suddenly get rougher, it rises late; see why indicators lag)
ATR is a price distance, so its size depends on the currency pair and timeframe. A pair quoted around 150 and one quoted around 1 give very different numbers, and so do daily and 5-minute charts. Compare it only within the same pair and timeframe.
Stop distance and ATR (you decide)
Some traders use ATR as one guide when setting their stop distance. But there is no single right multiple of ATR, or even a rule that you should use it, and this article does not decide that. If you use it, log these so you can see later how it worked for you:
- The ATR when you entered (with the pair and timeframe)
- Your stop distance, and how many times the ATR it was
- Whether the trade hit the stop or reached the target
The stop-loss and take-profit calculator finds the stop price, and the position size calculator finds the lot size that keeps your loss per trade the same for a given stop distance. Why a stop may not fill at your price after a gap is covered in limit vs stop orders.
Sources
- MetaQuotes. Average True Range (MetaTrader 5 Help). https://www.metatrader5.com/en/terminal/help/indicators/oscillators/atr