How to read a candlestick
In MT5, price can be shown as bars, Japanese candlesticks or a line.[1] Most other charting platforms offer the same choice. A candlestick shows four prices in a single bar.
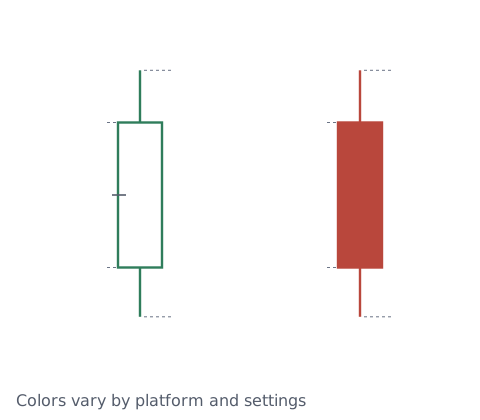
- Body: the box, between the open and the close
- Wick (also called a shadow): the thin line above and below the body, reaching the highest and lowest prices in that period
- Color: rising and falling candles differ in color or fill. Colors vary by platform and settings, and some screens use red for a rising candle, so check your platform
The time one candle covers depends on your timeframe. On a 15-minute chart, one candle is 15 minutes of price; on a daily chart, one day.
Shapes with names
Some single candles, and some groups of two or three, have names. Here are three you will see often (names vary a little between books and sites).
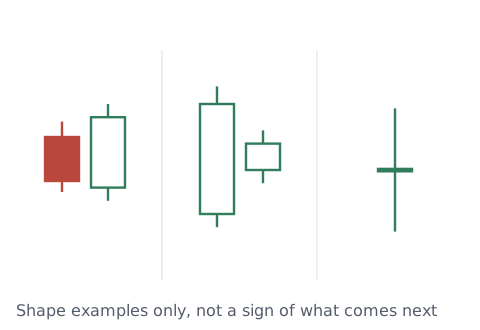
- Engulfing: the second candle's body completely covers the first candle's body
- Harami: the second candle's body fits inside the first candle's body
- Doji: the open and close are almost the same, so there is almost no body
These shapes are often described as signs that a move may change direction. But there is no single rule for how much a body must "cover" or how close is "almost the same". It differs between people and books.
What studies of these shapes in forex found
Studies of candle shapes in forex have found different things, depending on the shape and how it was tested.
- A study of engulfing patterns on 24 currency pairs (2000–2018, daily and 4-hour charts) reported statistically significant profitability within its tests, particularly for the seven major pairs, and noted that transaction costs matter a great deal.[2]
- A study of doji patterns using 13 years of data on eight heavily traded instruments, including gold (its trading tests used more than 38 million 1-minute bars), concluded that doji patterns are unreliable as signs of reversals in forex.[3]
Both are results for specific periods, currency pairs and ways of defining the shapes. With different definitions or costs, the results could differ, and past results may not hold in the future. Results differ by shape and by method, so a shape alone does not tell you price will rise or fall. Checking your own records is one way to see how it works for you. Whether and how you use shapes is your decision. For counting costs, see counting your trading costs.
Check against your own records
If you use shapes, put the shape in your strategy name, like "Engulfing" or "Doji", and note your own rule for what counts as that shape. Then you can see in numbers how it worked for you. The trading stats calculator turns a profit and loss list into win rate, average P&L and longest losing streak, and the break-even win rate calculator shows the win rate you need to break even. With few trades, the numbers can swing a lot.
Sources
- MetaQuotes. Charts (MetaTrader 5 Help). https://www.metatrader5.com/en/terminal/help/charts_analysis/charts; Chart Settings (line chart joins closing prices). https://www.metatrader5.com/en/terminal/help/charts_advanced/charts_settings
- Alanazi, A. S. (2020). The bullish and the bearish engulfing patterns: beating the forex market or being beaten? The European Journal of Finance, 26(15), 1484–1505. https://doi.org/10.1080/1351847X.2020.1748679
- Wangchailert, P., & Paireekreng, W. (2025). Enhancing FOREX Market Predictions: A Comparative Study of Candlestick Patterns and the MIDDAM Patterns. ECTI Transactions on Computer and Information Technology, 19(1), 121–134. https://doi.org/10.37936/ecti-cit.2025191.256994