What the hot hand is
A 1985 paper studied the belief in basketball that a player who is "hot" keeps making shots.[1] It says players and fans alike tend to believe a player's chance of a hit is greater after a hit than after a miss.[1]
If the gambler's fallacy is feeling that a streak means the opposite is due, the hot hand is feeling that a streak means more of the same.
What fans were asked
The paper surveyed 100 basketball fans who were students at two US universities.[1]
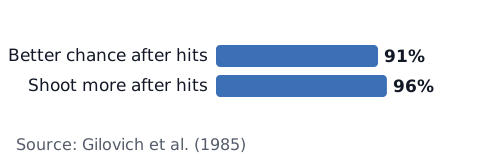
- 91% said a player has a better chance of making a shot after making the last two or three than after missing the last two or three[1]
- 96% said that after making a series of shots, players tend to take more shots than they normally would[1]
Yet when the authors analyzed a US professional team's shooting records, they found no evidence of a positive link between the outcomes of one shot and the next.[1]
How it was challenged later
A 2018 paper showed that a common way of measuring "success rate after a streak", used in the original study, has a built-in bias.[2] It reports that after correcting for this bias, the original study's long-standing conclusions are reversed.[2]
So one current view is that, once the bias is corrected, the basketball data point toward a hot hand existing. How large the effect is remains under debate. And this is research on basketball, not on markets.
In casino records
A study of roulette records in a US casino found that players bet on more numbers after winning than after losing.[3] The study notes this could also be explained by having more money after a win, or by the house money effect, rather than only by a belief in being "on a roll".[3]
Where it can show up in trading
For example (these are our own examples):
- After a winning streak, you feel you are on a roll and increase your lot size
- After a winning streak, you take setups you would usually skip, and trade more often
Whether your win rate is really higher after a winning streak differs from person to person, and this article cannot tell you. Only your own records can.
Check your own records (you decide)
- Win rate after a streak: for example, collect only the trades right after three wins in a row and compare their win rate with your overall win rate (treat small numbers as a rough guide)
- Lot size after a streak: is it bigger than usual?
- Number of trades after a streak: do you trade more times per day than usual?
The losing streak calculator shows how likely streaks are at a given win rate, and the trading stats calculator shows the numbers in your records. This article does not decide how you should trade.
Sources
- Gilovich, T., Vallone, R., & Tversky, A. (1985). The hot hand in basketball: On the misperception of random sequences. Cognitive Psychology, 17(3), 295–314. https://doi.org/10.1016/0010-0285(85)90010-6
- Miller, J. B., & Sanjurjo, A. (2018). Surprised by the Hot Hand Fallacy? A Truth in the Law of Small Numbers. Econometrica, 86(6), 2019–2047. https://doi.org/10.3982/ECTA14943
- Croson, R., & Sundali, J. (2005). The Gambler's Fallacy and the Hot Hand: Empirical Data from Casinos. Journal of Risk and Uncertainty, 30(3), 195–209. https://doi.org/10.1007/s11166-005-1153-2