How much is traded each day
Every three years, the BIS works with central banks to measure currency trading. In the April 2025 survey, over-the-counter (not on an exchange) FX trading averaged $9.6 trillion a day, up 28% from $7.5 trillion in 2022.[1]
These figures were collected from more than 1,100 banks and other dealers in 52 jurisdictions.[2] So they show trading by these dealers as a whole, not just trading by individual traders like you.
Types of trades
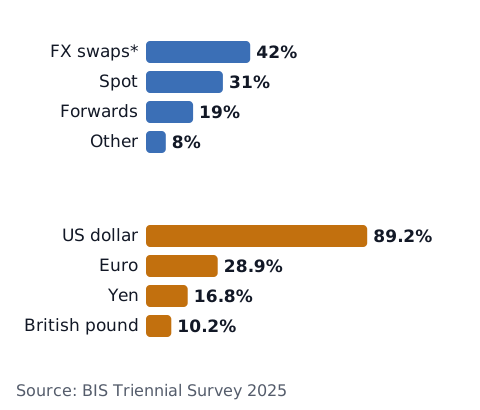
The biggest type was FX swaps (about 42%; exchanging two currencies now and swapping them back on a set date, not the overnight swap or rollover fee at a broker), followed by spot (trades settled right away, about 31%) and outright forwards (trades settled on a set future date, about 19%). Spot and forwards grew 42% and 60% from three years earlier, and their shares rose.[1] Swaps and forwards are commonly used to protect against currency moves (to hedge currency risk).[2]
Currency shares (adding up to 200%)
The US dollar was in 89.2% of all trades, the euro in 28.9%, the Japanese yen in 16.8% and the British pound (sterling) in 10.2%.[1] Shares for other currencies, including many emerging-market currencies, are listed in the BIS tables.[1]
These shares add up to 200%, not 100%. Each trade involves two currencies, such as "euro and US dollar", and each currency is counted once.[3] "US dollar 89.2%" means about 9 in 10 trades had the dollar on one side.
Where trading happens
By the location of the sales desks that handled the trades, the United Kingdom, the United States, Singapore and Hong Kong SAR together accounted for 75% of the total; the other 25% was in other countries and regions. Singapore's share rose to 11.8%, from 9.5% in 2022.[1] Currency trading does not happen on one exchange; it happens between banks and brokers around the world, and the main trading centers shift through the day. See forex market hours for when markets are open.
How this connects to your trading
The size of the whole market does not decide the result of your next trade. But which pairs you trade, and when, affects your costs through things like the spread (see what is the spread). This article does not decide which pairs or times to trade. Logging which pairs and times you trade, and how those trades went, lets you look back at them later.
To see how much margin a position needs at your leverage, use the margin calculator; to size a position by how much you are willing to lose, use the position size calculator.
Sources
- Bank for International Settlements. (2025). OTC foreign exchange turnover in April 2025 (Triennial Central Bank Survey). https://www.bis.org/statistics/rpfx25_fx.htm
- Bank for International Settlements. (September 30, 2025). Global FX trading hits $9.6 trillion per day in April 2025 and OTC interest rate derivatives surge to $7.9 trillion: Triennial Survey. https://www.bis.org/press/p250930.htm
- Bank of Finland Institute for Emerging Economies (BOFIT). (October 3, 2025). The yuan's share in international FX trading continues to grow. BOFIT Weekly Review 40/2025 (explains why currency shares add up to 200%).https://www.bofit.fi/en/monitoring/weekly/2025/vw202540_1/