A currency pair is two currencies
In EUR/USD, EUR on the left is the base currency and USD on the right is the quote currency. Buying the pair means buying the left currency and selling the right one. Selling the pair is the opposite.
- Buy EUR/USD: buy EUR, sell USD
- Buy GBP/USD: buy GBP, sell USD
- Buy USD/CAD: buy USD, sell CAD
- Buy USD/JPY: buy USD, sell JPY
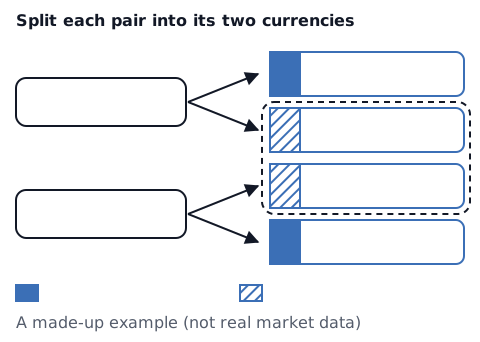
Pairs with different names can share a currency. When they do, you may be trading that currency more than once.
The US dollar is on one side of most FX trades. In the Bank for International Settlements (BIS) survey of April 2025, the US dollar was on one side of 89.2% of all foreign exchange trades, and the ten most traded currency pairs all included the US dollar.[1] (Each trade has two currencies, so the currency shares add up to 200%. These are the final figures, published in June 2026.)
What adding up by currency shows
Split every open position into a plus (bought) and a minus (sold) for each currency, then add up each currency.
Buy: base currency = +(lots × contract size), quote currency = −(lots × contract size × entry price)
Sell: the signs are reversed
The examples below use 1 lot = 100,000 units. Contract sizes differ between brokers and accounts, so check your broker's contract size. In this article, "." is the decimal point and "," separates thousands (for example, 1,234.50).
Worked example: buying EUR/USD and GBP/USD
A US dollar account, 1 lot = 100,000 units, 0.5 lots (50,000 units) of each (made-up numbers).
- Buy EUR/USD at 1.0800: EUR +50,000, USD −54,000
- Buy GBP/USD at 1.2700: GBP +50,000, USD −63,500
US dollar total: −54,000 − 63,500 = −117,500 USD
Both positions sell US dollars. If the US dollar rises against both the euro and the pound, both positions move against you.
Adding USD/CAD
Now add a USD/CAD buy of 0.5 lots at 1.3600: USD +50,000, CAD −68,000.
US dollar total: −54,000 − 63,500 + 50,000 = −67,500 USD
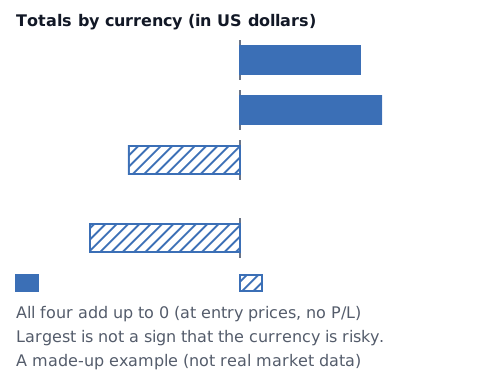
Here the USD/CAD buy offsets part of the US dollar sell. The euro, pound and Canadian dollar each still move on their own. Converted to US dollars at the entry prices (EUR at 1.0800, GBP at 1.2700, CAD at 1.3600), the four totals add up to zero, because at entry the amount bought and the amount sold are equal. If your totals do not add up to zero, there is a mistake in the calculation.
The same works for yen pairs. Buying USD/JPY, EUR/JPY and GBP/JPY together means selling yen three times.
When buys and sells are mixed: buy EUR/USD, sell GBP/USD
When the directions differ, a currency can cancel out. A US dollar account buys 0.5 lots of EUR/USD at 1.0800 and sells 0.5 lots of GBP/USD at 1.2700 (made-up numbers).
- Buy EUR/USD: EUR +50,000, USD −54,000
- Sell GBP/USD: GBP −50,000, USD +63,500
US dollar total: −54,000 + 63,500 = +9,500 USD
In US dollars that is EUR +54,000, GBP −63,500 and USD +9,500, and 54,000 − 63,500 + 9,500 = 0 (the check). The US dollar mostly cancels out. What is left is buying euros and selling pounds, so the two positions together are close to buying EUR/GBP.
If your account is not in US dollars
If your account is in euros, pounds, Australian dollars or another currency, the totals by currency are the same; only the last step, converting into your account currency, changes. For example, with an Australian dollar account and AUD/USD at 0.6500 (a made-up rate), a 300 USD loss is 300 ÷ 0.6500 ≈ 461.54 AUD.
If one side of a pair is your account currency itself, such as the AUD in AUD/USD in an Australian dollar account, that side is already in your account currency. What changes your balance is the other side: in this case, the US dollars you sold.
Pairs that move together can hit their stops together
The correlation coefficient measures how closely two price moves go the same way. Close to +1 means the same direction, close to 0 means little relation, close to −1 means opposite directions.
EUR/USD and GBP/USD are both prices against the US dollar, so they often move the same way. A study of daily data from 1986 to 2011 found positive correlations between the euro (the Deutsche mark before the euro), pound, Swiss franc and yen against the US dollar, strongest among the European currencies.[2] Another study found that part of exchange rate moves against the dollar is shared across many currencies: two common factors explained 18% to 80% of monthly moves, depending on the currency.[5]
Study [2] covers only the euro (mark), pound, Swiss franc and yen; the Australian dollar is not in it. The Australian dollar and other so-called commodity currencies can move differently from the euro and the pound (this article does not check that with numbers).
If you hold two strongly correlated pairs in the same direction, when one hits its stop, the other is more likely to hit its stop too. Two positions can behave almost like one bigger position.
Correlation changes over time
Correlation is not a fixed number. In the study above, the correlation between the euro and the pound against the US dollar was 0.59 in 1994–1998 (before the euro, so the Deutsche mark), 0.61 from 1999 to February 2002, and 0.73 from March 2002 to November 2007 (values the author computed to match the periods of an earlier study).[2] The paper's overall conclusion, though, is that co-movements were lower on average after the euro was introduced.[2] In the period after the euro (1999–2011), correlations moved between −0.459 and 0.983, depending on the pair, and tended to rise during recessions and financial crises.[2] A paper by Federal Reserve Board researchers also found that the dependence between exchange rates varies over time.[3]
When you look at a correlation number, keep in mind:
- It depends on the period it was calculated over. A correlation you see in a tool or on a website is for that period only.
- Researchers have pointed out that in very volatile periods, the plain correlation coefficient tends to come out higher (this research was on stock markets).[4]
- Pairs with a low correlation in the past can still move together on a given day.
ρ (rho) is the correlation. You can skip this box.
Say each of two positions swings by 100 USD a day (the standard deviation, meaning the size of a typical day's swing). If you hold both in the same direction, the combined swing, using correlation ρ, is:
Combined swing = √(100² + 100² + 2 × ρ × 100 × 100)
With ρ = 0 it is about 141 USD, with ρ = 0.6 about 179 USD, and with ρ = 1 it is 200 USD. The higher the correlation, the closer the combined swing gets to that of one position (this is just the arithmetic).
If you buy one and sell the other, the sign of the correlation works the other way: "+ 2 × ρ" becomes "− 2 × ρ". With ρ = 0.6 the combined swing is about 89 USD, and the higher the correlation, the smaller it gets.
Add up the loss to every stop
You may have set a stop-loss amount for each position, but the total across everything you hold can be larger than it feels.
Loss at one stop = lots × contract size × stop distance in pips × pip size (in the quote currency), converted to your account currency
- EUR/USD and GBP/USD (0.5 lots each, 30-pip stops): 50,000 × 30 × 0.0001 = 150 USD each, 300 USD for both
- Adding USD/CAD (0.5 lots, 30-pip stop): 50,000 × 30 × 0.0001 = 150 CAD, which is 150 ÷ 1.3600 ≈ 110.29 USD. Total for all three: about 410.29 USD
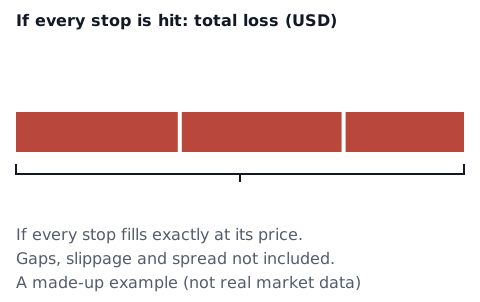
This total assumes every stop fills exactly at its price. Around weekend gaps or news releases, a stop can fill at a worse price (price gaps and stop losses, what is slippage). Spread, commission and swap are not included. A position with no stop cannot be added up this way. The CAD amount is converted at the entry rate; the actual rate when the stop hits will differ slightly. With an Australian dollar account and AUD/USD at 0.6500, the same 410.29 USD would be about 631.22 AUD.
You can work out a lot size from a loss amount with the position size calculator, and pip values with the pip value calculator. For a daily cap on losses, see how to set a daily loss limit. To add up your positions by currency and see the total loss if every stop is hit, use the currency exposure calculator.
Check it in your records (the decision is yours)
This article does not tell you whether to hold the same currency more than once, or which pairs to combine. Overlap is not good or bad in itself. Adding up by currency is a way to know which currencies you hold, and how much.
Before opening a new position, you could note:
- The other positions you have open (pair, direction, lots)
- Your largest total (buy or sell, by size), and its amount. Not a sign that the currency is risky.
- The total loss if every stop is hit
- Why you added this position, and how you felt
After a while, you can count in your own records how often several stops were hit on the same day. How accounts count positions on the same pair (netting and hedging) is in what is hedging, and the profit calculation is in how to calculate forex profit.
Sources
- Bank for International Settlements. Triennial Central Bank Survey of foreign exchange and OTC derivatives markets in 2025: OTC foreign exchange turnover in April 2025 (preliminary release, 30 September 2025). https://www.bis.org/statistics/rpfx25_fx.htm (the figures in this article are taken from this preliminary release; final results were published in June 2026: survey page)
- Antonakakis, N. Exchange return co-movements and volatility spillovers before and after the introduction of euro. Journal of International Financial Markets, Institutions and Money 22(5), 1091–1109 (December 2012). https://doi.org/10.1016/j.intfin.2012.05.009 (author's working paper version: FIW Working Paper No. 80, https://www.fiw.ac.at/wp-content/uploads/2023/02/N_080-Antonakakis.pdf)
- Benediktsdóttir, S., Scotti, C. Exchange Rates Dependence: What Drives It? Board of Governors of the Federal Reserve System, International Finance Discussion Papers No. 969 (2009). https://www.federalreserve.gov/pubs/ifdp/2009/969/ifdp969.htm
- Forbes, K., Rigobon, R. No Contagion, Only Interdependence: Measuring Stock Market Comovements. Journal of Finance 57(5), 2223–2261 (2002). NBER Working Paper 7267. https://www.nber.org/papers/w7267
- Verdelhan, A. The Share of Systematic Variation in Bilateral Exchange Rates. Journal of Finance 73(1), 375–418 (2018). https://dspace.mit.edu/handle/1721.1/122354